9. Cluster nodes
"Cluster nodes" provides a list of working nodes. You can get information on nodes usage and terminate them in this tab.
Note: Nodes remain for the time that is already paid for, even if all runs at the node finished execution. So if you restart pipeline, new nodes will not be initialized saving time and money.
Overview
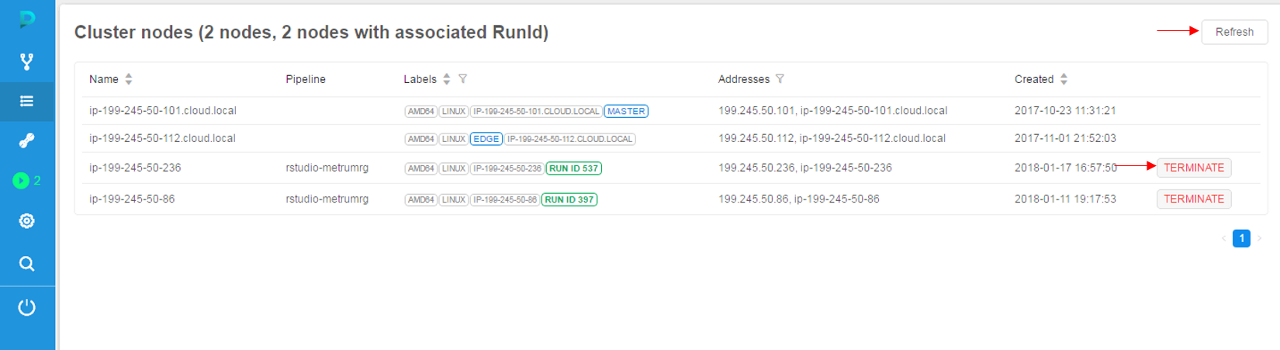
This tab shows Active nodes table that has information about:
- Name - a name of the node.
- Pipeline - a currently assigned run on the node.
- Labels of the node - characteristics extracted from the parameters of the node.
There are common labels: RUN ID - ID of currently assigned run, MASTER/EDGE - service labels, nodes with this labels may be viewed only by ADMIN users. - Addresses - node addresses.
- Created - a date of creation.
Controls
| Control | Description |
|---|---|
| Terminate | This control terminates node. |
| Refresh | To get currently active nodes list. |
Note: You can also terminate a node via CLI. For more details see here.
Node information page
Note: You can also view node information via CLI. See 14.6. View cluster nodes via CLI.
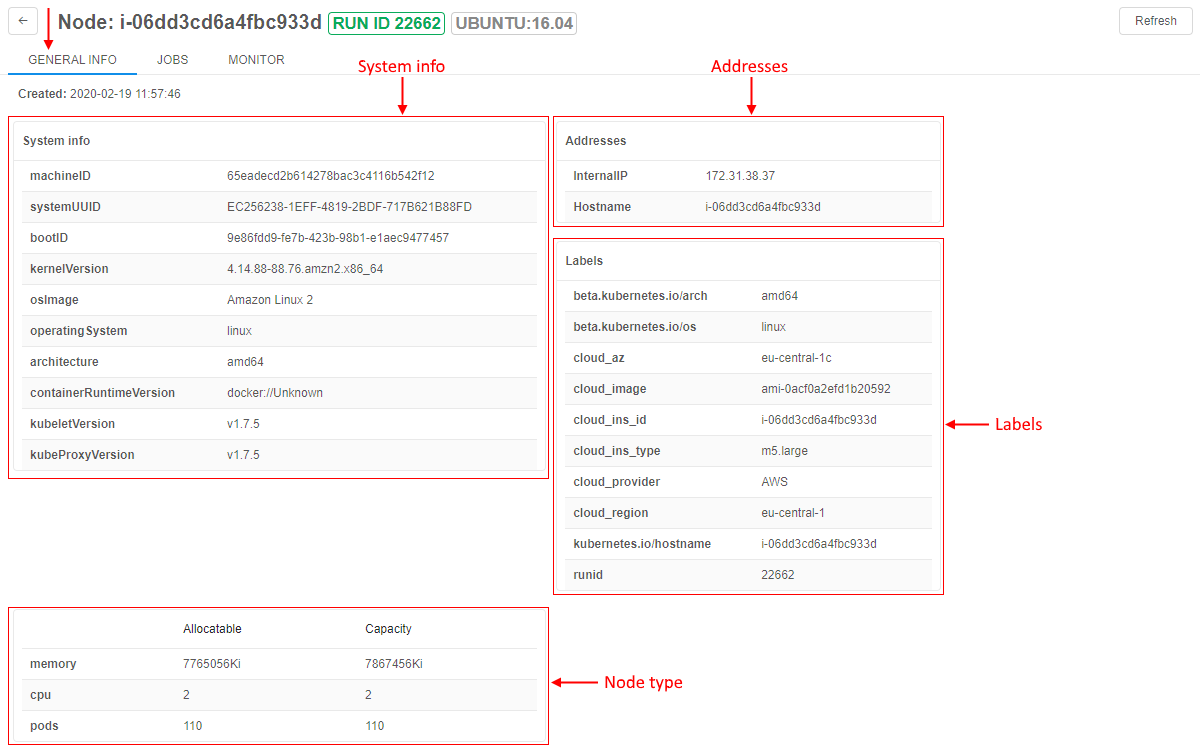
Clicking on the row of the table will redirect you to detailed node information page. This page has three tabs.
GENERAL INFO
This tab allows seeing general info about the node, including:
- System information;
- Addresses of internal network and domain name;
- Labels of the node automatically generated in accordance with system information;
- Node type - amounts of available and total memory, number of jobs and CPUs.
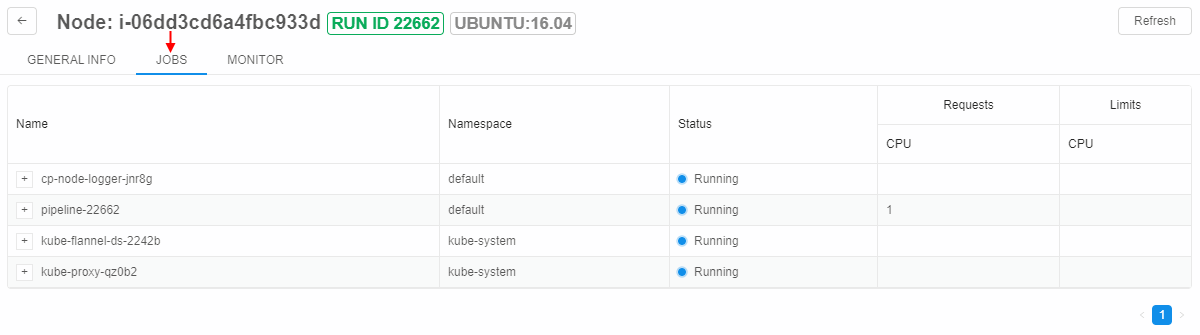
JOBS
"JOBS" tab lists jobs being processed at the moment.
- Name of the job; clicking "+" icon next to the name expands a list of containers needed for the job.
- Namespace for a job to be executed at;
- Status of the job;
- Requests and Limits of resources for the job.
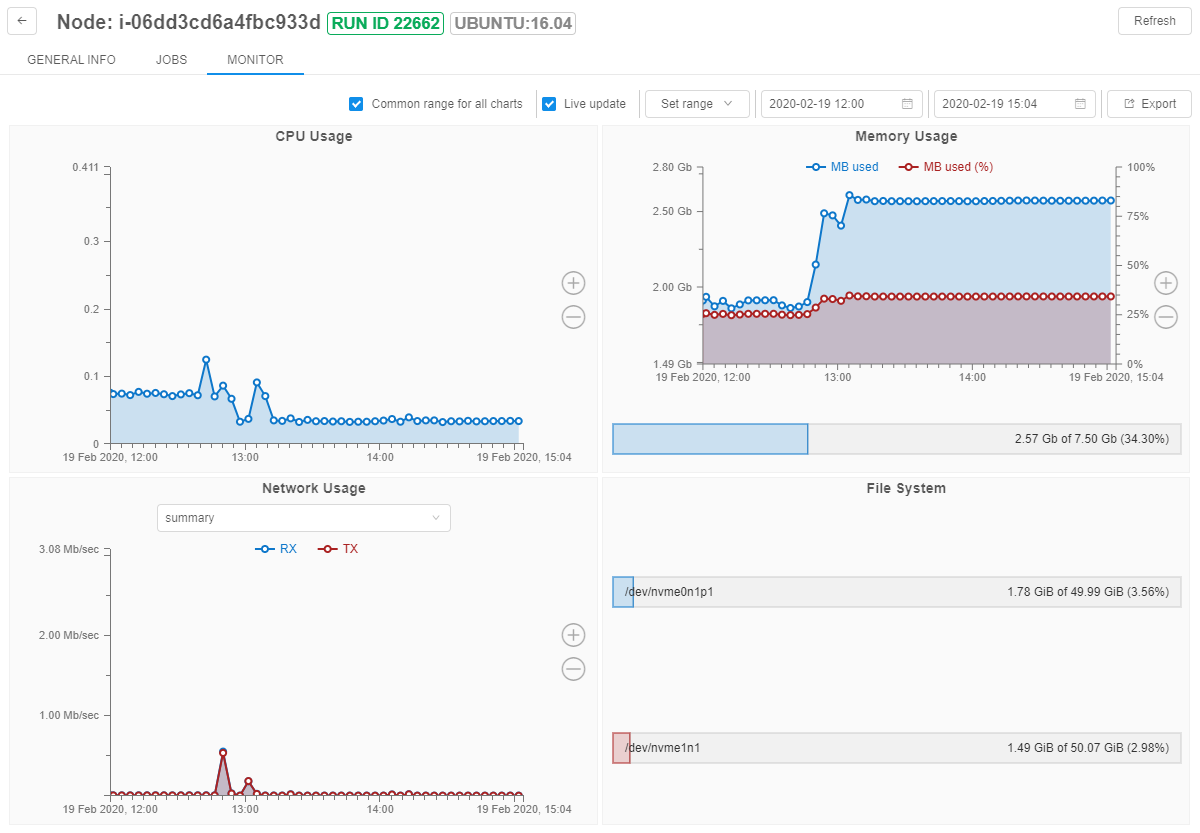
MONITOR
"MONITOR" tab displays dashboards with different charts of node characteristics.
This tab includes subtabs:
- General statistics - contains charts of general statistics that are available for any node
- GPU statistics - contains charts of statistics that are available for GPU nodes only
General statistics
This subtab includes following diagrams:
| Diagram | Description |
|---|---|
| CPU usage | A diagram represents CPU usage (cores) - time graph. The usage is displayed in fractions according to left vertical axis. There are two lines (data-series) - the first displays max value of the CPU usage in each moment and the second shows the average value of the usage during the time. |
| Memory usage | A diagram represents memory usage - time graph. One type of graph represents usage in MB according to left vertical axis. It includes two lines - first shows the max value in each moment and another shows the average values during the time.Another type of graph represents usage in % of available amounts of memory according to right vertical axis (analogically, includes two lines - max and average). |
| Network connection speed | A diagram represents connection speed (bytes) - time graph. Blue graph (TX) represents "transmit" speed. Red graph (RX) represents "receive" speed. Drop-down at the top of the section allows changing connection protocol. |
| File system load | Represents all the disks of the machine and their loading. |
The current state of the resources utilization is available for all active runs.
The maximum storage period for this data is set by the system preference system.resource.monitoring.stats.retention.period (in days, by default - 5).
So, any utilization data older than that period is unavailable for users (no matter the run duration).
The historical resources utilization is also available for completed runs (during the specified time storage period). It can be useful for debugging/optimization purposes.
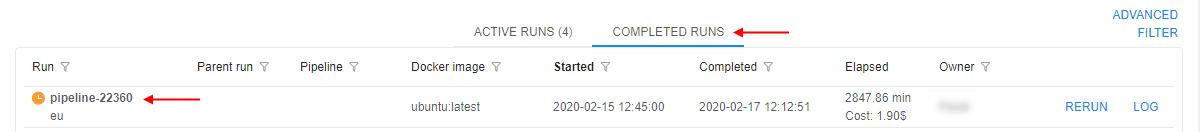
To view the monitor of resources utilization for the completed run:
- Open the COMPLETED RUNS page. Click the run you wish to view the resources utilization data, e.g.:
- At the opened Run logs page expand the "Instance" section:
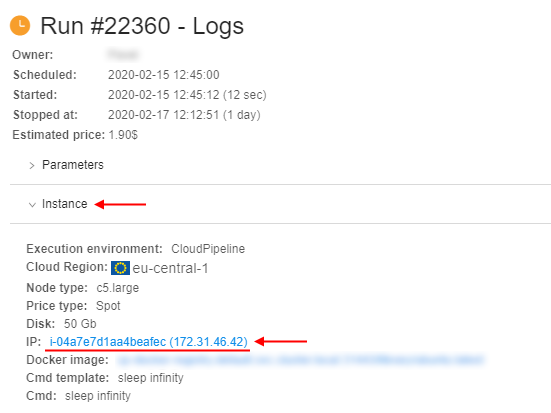
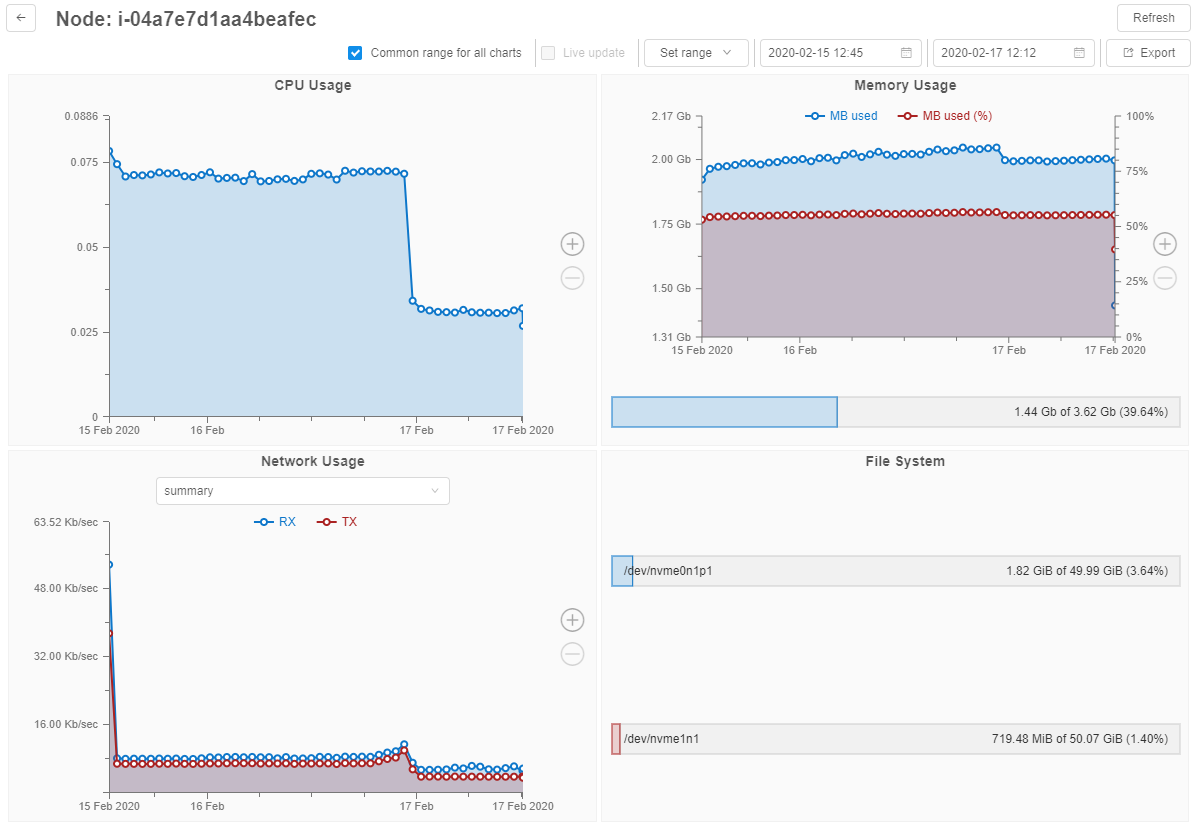
Click the node IP hyperlink. - The monitor of the node resources utilization will appear:
Please note, the resources utilization data for the completed run is available during
system.resource.monitoring.stats.retention.perioddays.
If you'll try to view monitor of the completed run after the specified period is over - the monitor will be empty.
Filters
User can manage plots date configurations. For this purpose the system has number of filters:

Common range for all charts (1)
User can synchronize the time period for all charts. To do so user should mark this filter.
If this filter is unmarked, user can zoom or scroll any plot without any change for others.
Live update (2)
If this checkbox is marked the charts data will be updated every 5 seconds in a real-time manner. The fields with dates will be updated as well.
This filter can be marked only in pair with the Common range for all charts filter.
If both checkboxes were unmarked and user set the Live update filter active, the system would mark both checkboxes.
This feature is available only for active runs.
Set range (3)
User can select the predefined time range for all plots from the list:
- Whole range
- Last week
- Last day
- Last hour
This filter works in pair with the Common range for all charts filter. If user sets the date range, the system will mark the Common range for all charts checkbox, if it wasn't. So the data in all charts will be filtered by the selected range.
Date filter (4)
User can specify the Start and the End dates for plots using this filter.
By default, the Start date (the left field of the filter) is the node creating datetime, the End date (the right field of the filter) is the current datetime.
To change the Start\/End date the user should:
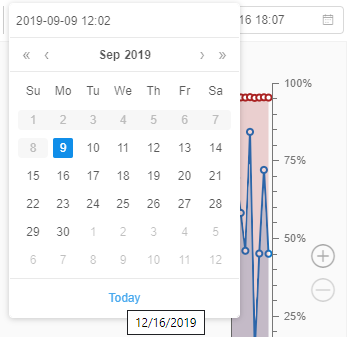
- click the corresponding date field, e.g.:
- the calendar will be displayed:
The dates before the node creation and after today will be unavailable to select:
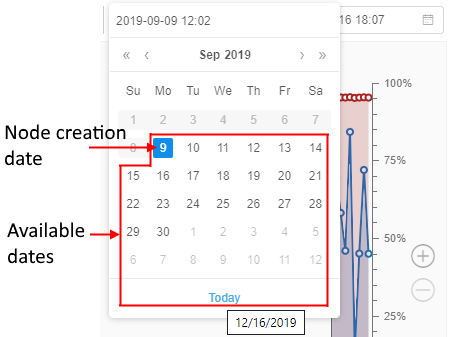
- click the specific available date in the calendar. Selected date will appear in the date field. Charts will be automatically redrawn according to the new set period.
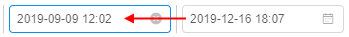
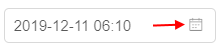
If the user focuses on the calendar icon or the whole field at any of date fields the "Cross" button will be displayed:
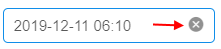
If click this button in the Start date field - the node creation date will be substituted into that filter.
If click this button in the End date field - the date in that field will be erased and the system will interpret it as the current datetime.
Zooming and scrolling features
In addition, user can scroll plots.
To do so:
- focus on the plot, hold the left mouse button and move the mouse in the desired direction (left or right)
- Note: if Common range for all charts filter is on, all charts will be moving simultaneously
Another feature is chart zooming.
To zoom a chart:
- hold the Shift key and scroll the plot via mouse. The area will be highlighted:
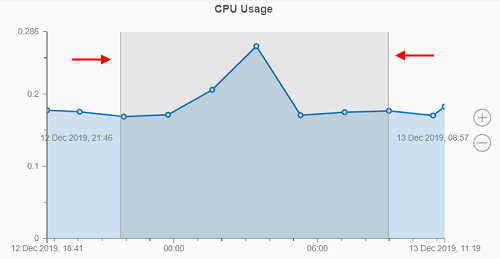
Then release the Shift key and the highlighted area will be automatically zoomed. - another way of zooming plot - using the right panel. There are Plus and Minus buttons for such purpose on it:
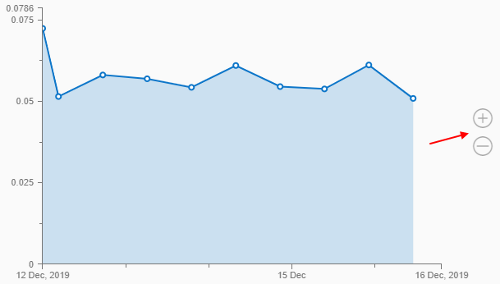
Click the desired button and the chart will be zoomed.
Export utilization data
Users have the ability to export the utilization information into a csv or xls file.
This can be useful, if the user wants to keep locally the information for a longer period of time than defined by the preference system.resource.monitoring.stats.retention.period.
csv reports contain only raw monitoring data.
xls reports contain not only raw monitoring data but the graphical info (diagrams) too as users can see on the GUI.
To export resources utilization data at the Monitor page of the node:
- Hover over the Export button in the right upper corner of the page:
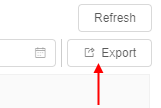
- There are the following items in the list:
- Excel - to download the monitoring report in
xlsformat with default settings - CSV - to download the monitoring report in
csvformat with default settings - Configure export - to customize intervals between resources utilization statistics, select format and download a report with that custom settings
- Excel - to download the monitoring report in
- If you select Excel or CSV item in the list, the corresponding file will be downloaded automatically
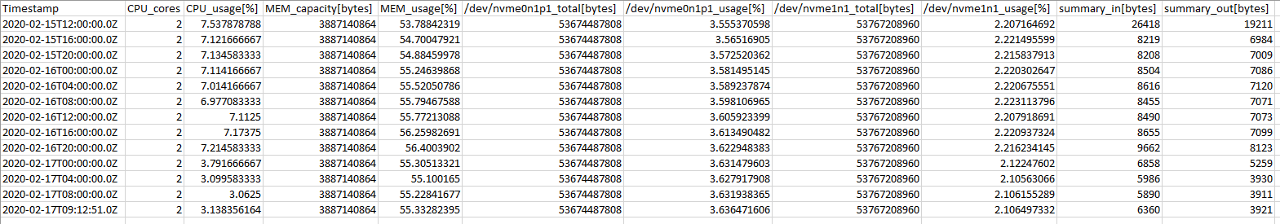
Example of csv report file:
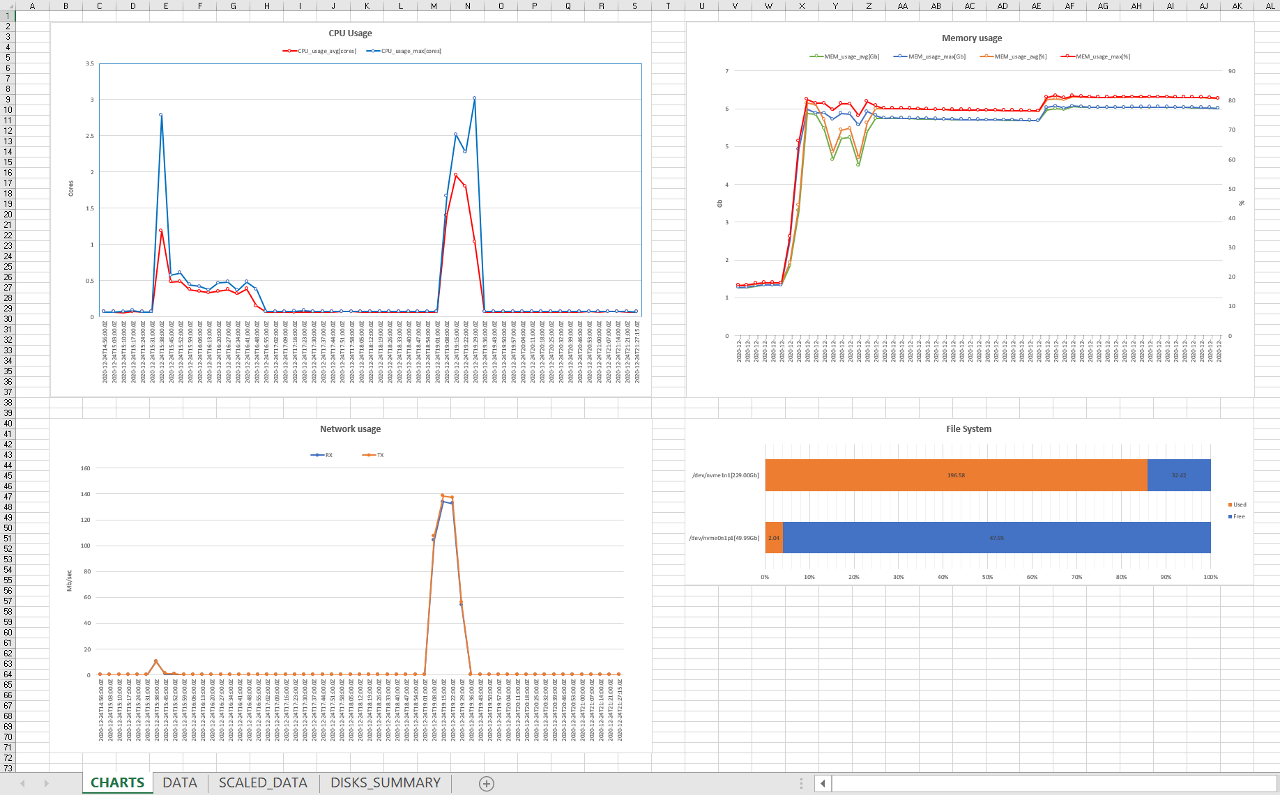
Report in xls format contains the following datasheets: 
- CHARTS - datasheet with diagrams equal to the ones on the GUI ("CPU usage", "Memory usage", "Network connection speed", "File system load"), e.g.:
- DATA - datasheet with raw resources utilization statistics (similar to
csvreport), e.g.:
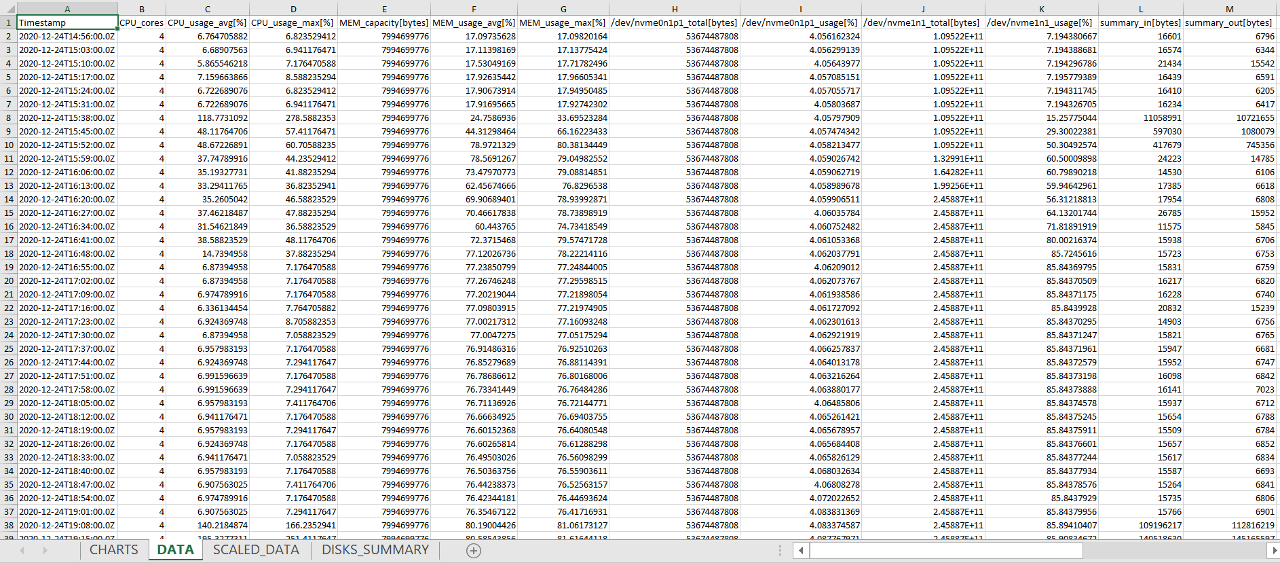
- SCALED_DATA and DISKS_SUMMARY - auxiliary datasheets with data selection from DATA datasheet that are needed for building charts
To configure the export click the Configure export button in the list. The pop-up will be open:
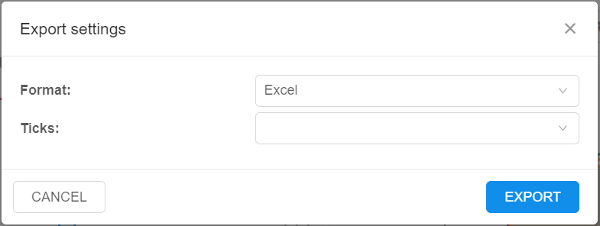
Here:
- Format dropdown list defines the format for the report (
xls/csv) to be exported - Ticks dropdown list defines the interval of resources utilization statistics that will be exported (Note: the suggested intervals in the list depends on the node running duration), e.g.:
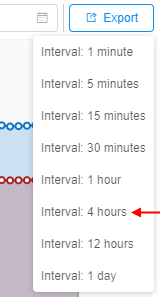
- once the settings are configured click the EXPORT button - the report will be prepared and downloaded
You also can export node usage report via CLI. See here.
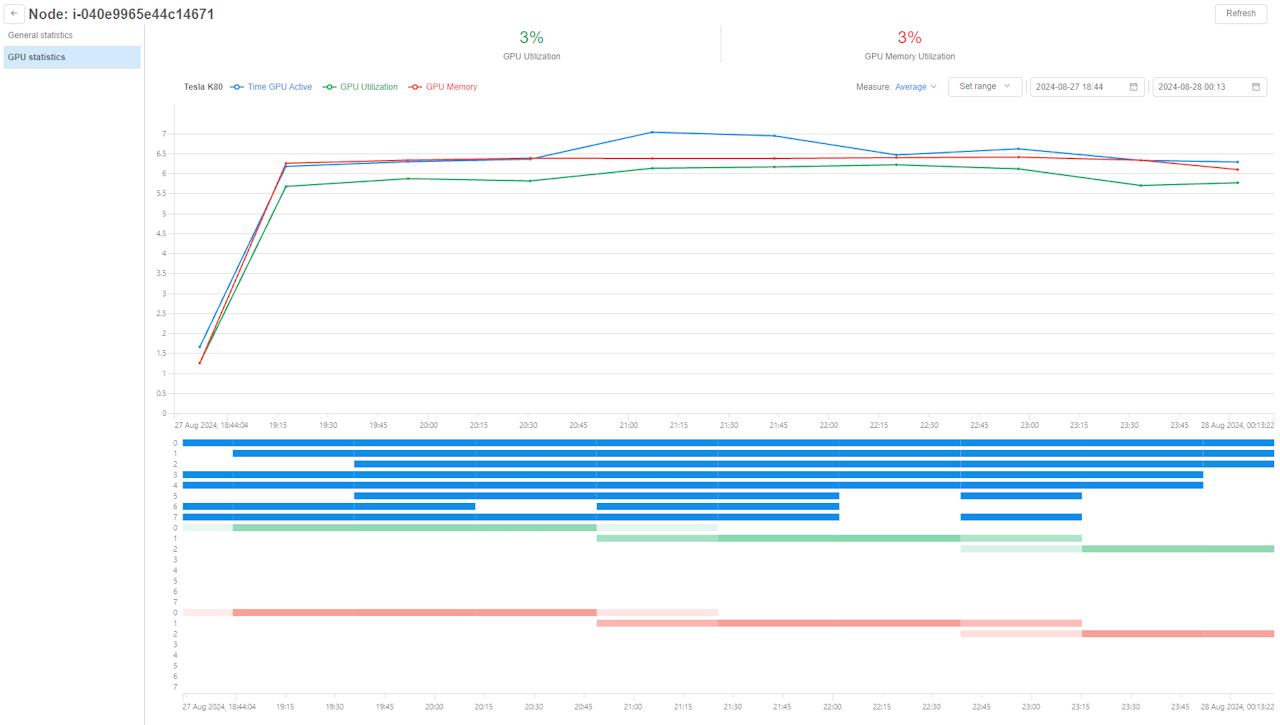
GPU statistics
This subtab displays different characteristics of GPU cards utilization of the node for the selected time range (by default - from the node initialization till the current moment):
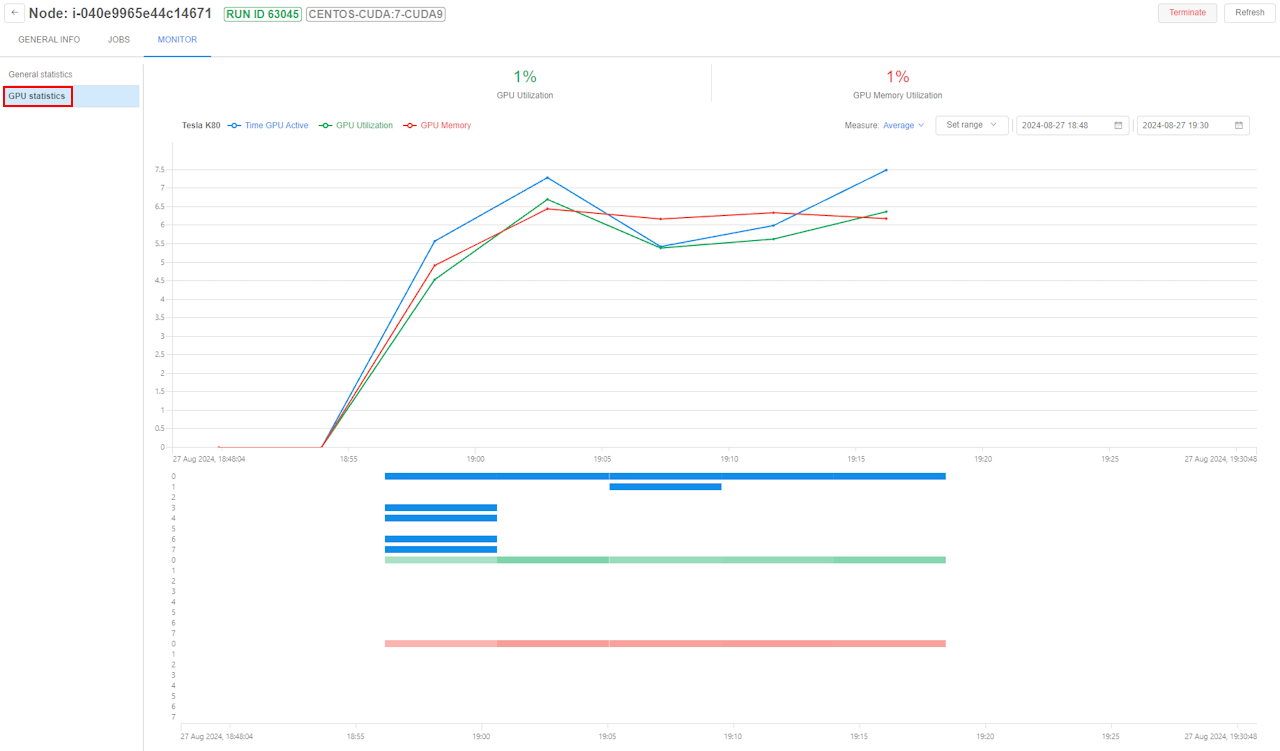
Dashboard includes 3 parts:
- Global GPU metrics - header in the top of the subtab with metrics:
- GPU utilization -
mean/max/minof all average GPU cards utilization for the selected node's run time range - GPU Memory utilization -
mean/max/minof all average GPU cards memory utilization for the selected node's run time range

- GPU utilization -
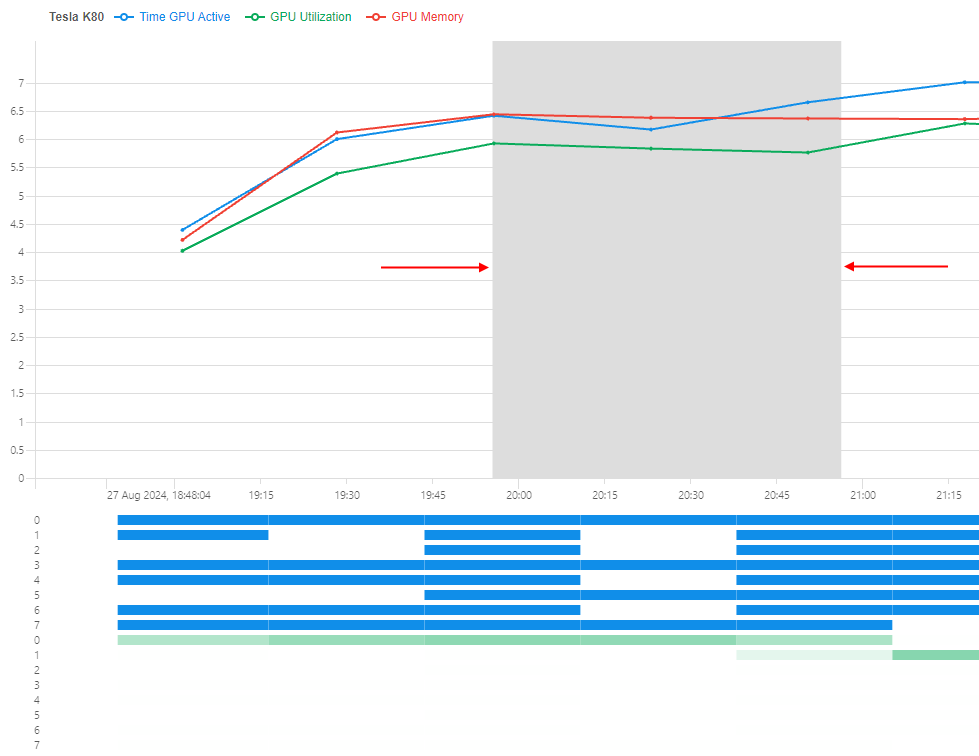
- Global chart - line chart for the following metrics:
- Time GPU Active (blue line) - in each timepoint of the selected range, shows percentage of GPU cards which have GPU utilization more than 0
- GPU Utilization (green line) - in each timepoint of the selected range, shows
mean/max/minGPU utilization (in percents) among all node's GPU cards - GPU Memory (red line) - in each timepoint of the selected range, shows
mean/max/minGPU memory utilization (in percents) among all node's GPU cards
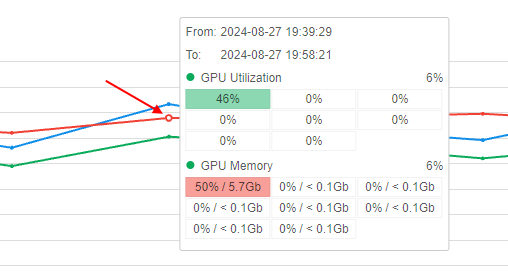
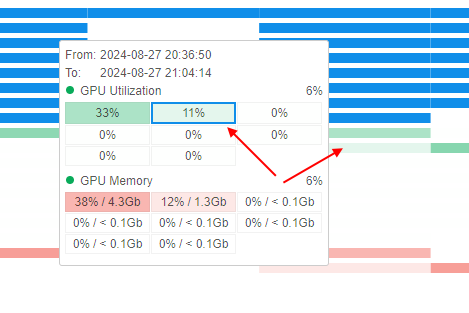
- When hovering over any point of this chart, a tooltip is shown with details:
- period of time that this point describes
- detailed GPU Utilization: each GPU card is shown as a separate rectangle with a value of that card's utilization. The higher the utilization value, the more saturated color of the rectangle is. Near the block, one aggregated value of GPU Utilization is shown -
mean/max/minaccording to displaying settings. - detailed GPU Memory Utilization: each GPU card is shown as a separate rectangle with a value of that card's memory utilization (in percents and Gb). The higher the utilization value, the more saturated color of the rectangle is. Near the block, one aggregated value of GPU Memory Utilization is shown -
mean/max/minaccording to displaying settings. - no matter at which line a point is selected - the tooltip for one time point will be the same for all line charts
- Detailed heatmap - shows Time GPU Active, GPU Utilization and GPU Memory metrics as heatmap at each time point:
- heatmap is divided to blocks vertically where each block presents a single metric
- in each heatmap block, one GPU card is shown by one row. Therefore, the whole number of heatmap rows equals
3 * <GPU_cards>, where<GPU_cards>- nuber of GPU cards of the node - each heatmap cell (at the intersection of a row - GPU card ID, and a column - time point) is shown as a separate rectangle colorized according to the metric value in that timepoint - with a saturation gradient - the higher the metric value, the more saturated color of the rectangle is. If the metric value is 0%, rectangle is not shown
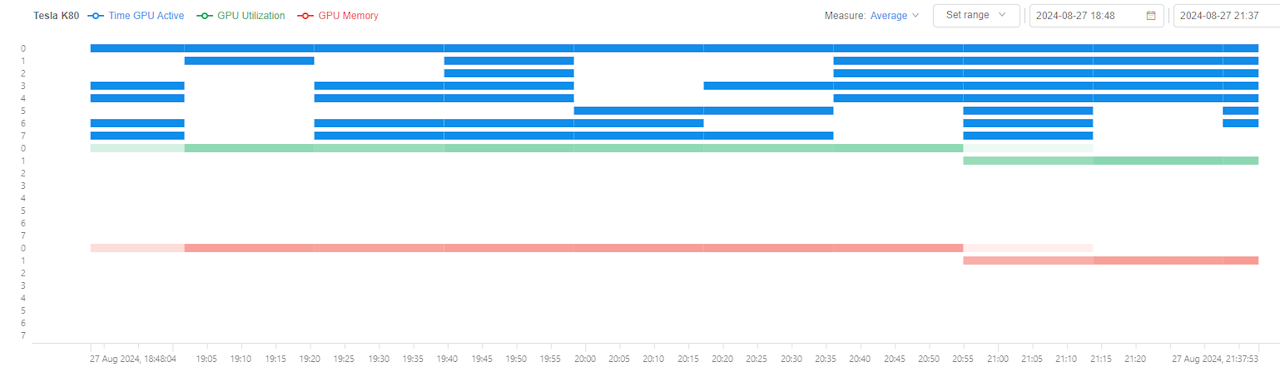
- when hovering over any point of this heatmap, a tooltip similar to the one for line charts is shown. The one difference - rectangle of the selected GPU card has the bold color border:
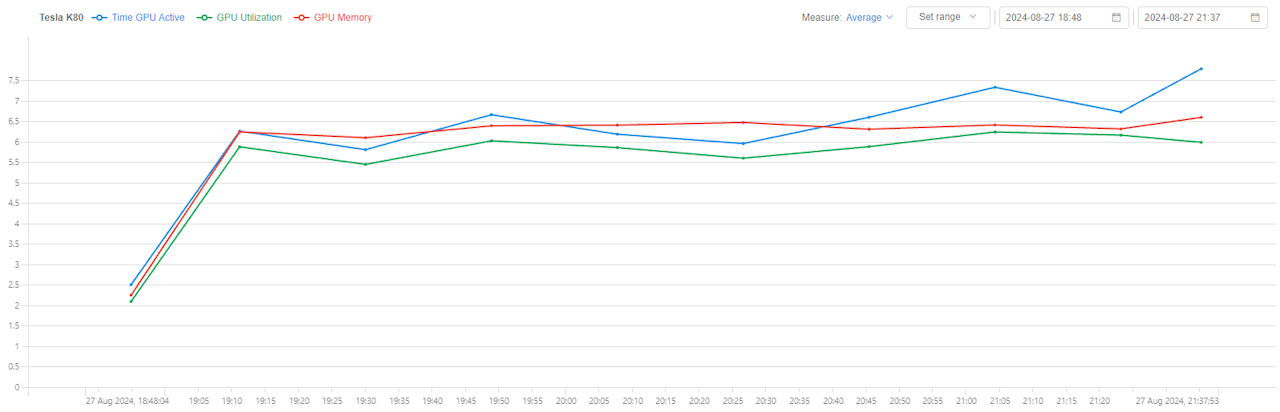
The historical GPU resources utilization is also available for completed runs (during the specified time storage period).
It can be useful for debugging/optimization purposes and looks similar to the GPU resources utilization dashboard of the active run, e.g.:
Please note, the resources utilization data for the completed run is available during
system.resource.monitoring.stats.retention.perioddays.
If you'll try to view monitor of the completed run after the specified period is over - the monitor will be empty.
GPU Filters
The displayed data at the GPU statistics dashboard can be configured. For this purpose there is a number of filters:
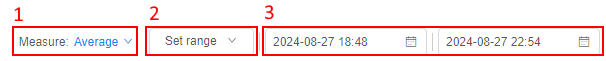
Measure (1)
Dropdown-list that allows to select how metrics will be calculated at the line chart and heatmap:
Average(default) - value in each point is calculated as mean among all node's GPU cards values of that metricMin- value in each point is calculated as minimum among all node's GPU cards values of that metricMax- value in each point is calculated as maximum among all node's GPU cards values of that metric
For example, line chart when Measure is Max:
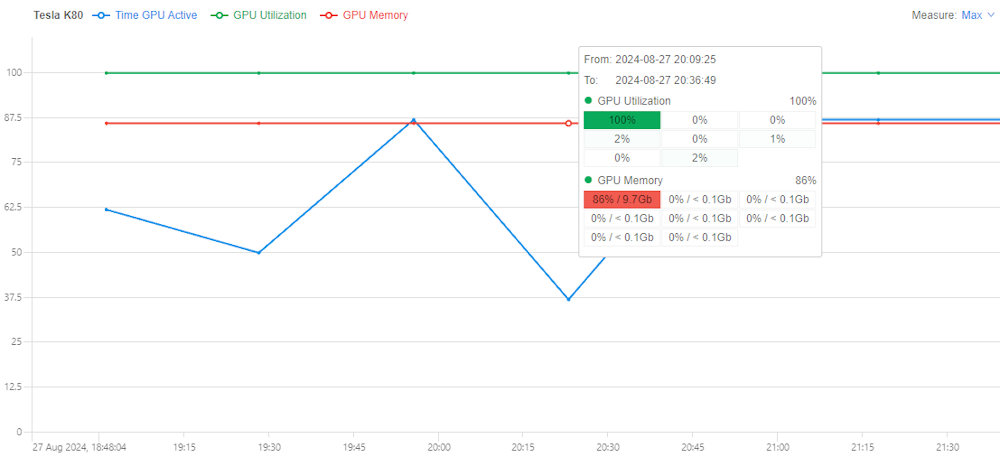
Note: this filter affects the displaying of GPU Utilization, GPU Memory metrics at Global GPU metrics header, Global chart and Detailed heatmap.
Set range (2)
Filter allows to select the time range for which metrics shall be calculated and shown on charts:
- Last week
- Last day
- Last hour
Date filter (3)
Filter allows to specify the Start and the End dates for charts.
By default, the Start date (the left field of the filter) is the node creating datetime, the End date (the right field of the filter) is the current datetime.
Charts are being automatically redrawn in case when a new range is set (if applicable).
Zoom and scroll GPU statistics
To scroll over charts time range: focus on the chart/heatmap, hold the left mouse button and move the mouse in the desired direction (left or right). All charts will be redrawn simultaneously.
To zoom over charts time range:
- focus on the chart/heatmap, then holding the Shift key, scroll via mouse. Time range will be automatically zoomed - and charts will be redrawn according to the new selected time range
- OR focus on the chart, then holding the Shift key, select the area on the chart via mouse. The area will be highlighted:
Then release the Shift key and the highlighted area will be automatically zoomed according to the new selected time range.