Automatic actions with runs
In this section, let's consider the configurable behavior of automatic actions/notifications for the launched runs that are being in "idle", "under pressure" or "network pressure" state for a long time.
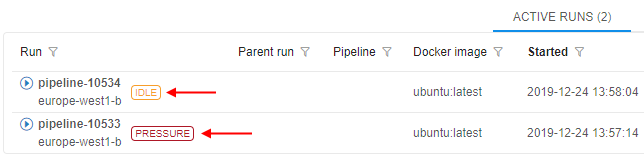
The following view of high-level metrics information for the Active Runs is implemented:
 - this auxiliary label is shown when node's CPU consumption is lower than a certain level, defined by the admin. This label should attract the users attention cause such run may produce extra costs.
  - this auxiliary label is shown when node's Memory/Disk consumption is higher than a certain level, defined by the admin. This label should attract the users attention cause such run may accidentally fail.
 - this auxiliary label is shown when node's network consuming is higher than a certain level, defined by the admin. This label should attract the users attention cause such run may lead to network failures.
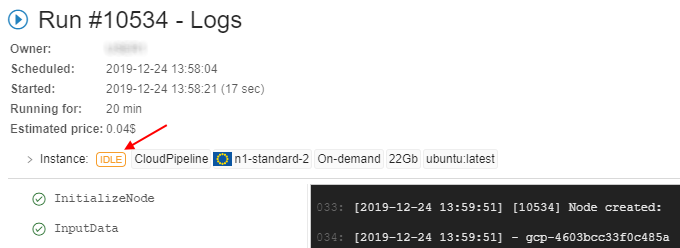
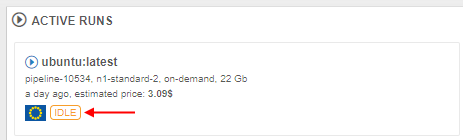
These labels are displayed:
- at the Runs page
- at the Run logs page
- at the main dashboard (the ACTIVE RUNS panel)
By click that label, the Cluster node Monitor will be opened to view the current node consumption.
Admins can configure the emergence of these labels and system actions by the system-level parameters or Cloud Pipeline API.
"Idle" runs
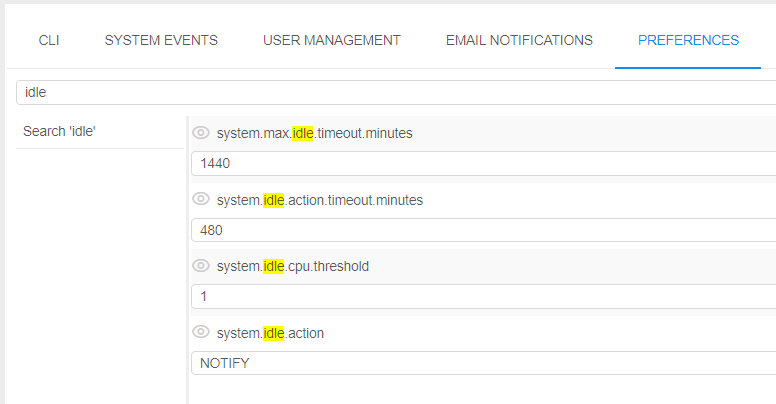
The system behavior for the "idle" runs is defined by the set of the following System-level parameters (Preferences):
| Preference name | Description |
|---|---|
system.max.idle.timeout.minutes |
Specifies the duration in minutes after that the system should check node's activity. If after this duration node's CPU utilization will be below system.idle.cpu.threshold - email notification IDLE_RUN will be sent to the user and the run itself will be marked by the label |
system.idle.action.timeout.minutes |
Specifies the duration in minutes. If node's CPU utilization is below system.idle.cpu.threshold for this duration after the system.max.idle.timeout.minutes is over - an action, specified in system.idle.action will be performed |
system.idle.cpu.threshold |
Specifies percentage of the node's CPU utilization, below which an action shall be taken |
system.idle.action |
Sets which action to perform with the node, that has the CPU utilization below than system.idle.cpu.threshold:
|
system.resource.monitoring.period |
Specifies period (in milliseconds) between the scannings of running instances to collect the monitoring metrics. After each such period, it's defined to display label for the specific instance or not |
Example of these settings:
In general, the behavior will be the following:
- User launches a run
- After
system.max.idle.timeout.minutesperiod, the system starts to check the node's activity. - If the node's CPU utilization becomes below
system.idle.cpu.threshold: email notification IDLE_RUN is being sent, the run itself is being marked by the label - After
system.idle.action.timeout.minutes, if the node's CPU utilization is still belowsystem.idle.cpu.threshold:- email notification IDLE_RUN is being sent (in case when
system.idle.actionis set as NOTIFY) - run is being paused/stopped and the corresponding email notification IDLE_RUN_PAUSED or IDLE_RUN_STOPPED is being sent (in case when
system.idle.actionis set as PAUSE/PAUSE_OR_STOP/STOP)
- email notification IDLE_RUN is being sent (in case when
- In case when
system.idle.actionis set as NOTIFY, email notifications IDLE_RUN continue to be sent everysystem.idle.action.timeout.minutes, if the node's CPU utilization remains below thesystem.idle.cpu.threshold - The state of the label (to display or not) is checked every
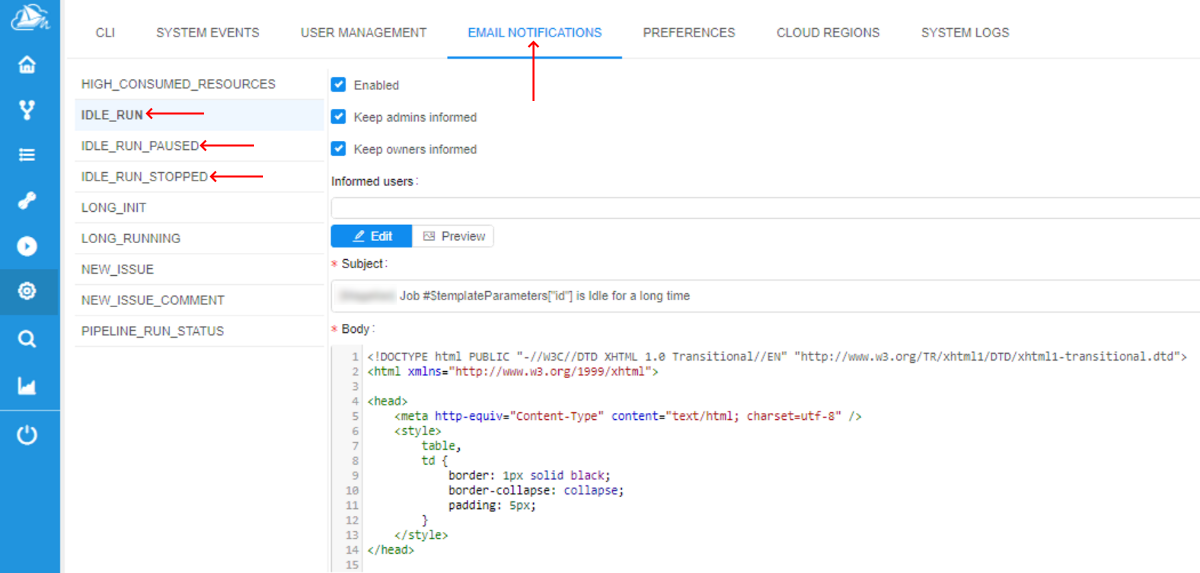
system.resource.monitoring.period - The settings of the email notifications (message, the list of informed users, etc.) the admin can configure via the corresponding tab Email notifications of the system-level settings:
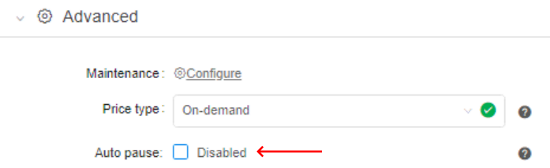
Note: users can manually disable the automatic pausing of on-demand instances if they aren't used. For that the "Auto pause" checkbox at the Launch page shall be unchecked before the run:
This action cancels only the auto pause, but the RUN_IDLE email notifications will be being sent (if the corresponding conditions will be met).
"Pressure" runs
The system behavior for the runs "under pressure" (high-consumed) is defined by the set of the following System-level parameters (Preferences):
| Preference name | Description |
|---|---|
system.disk.consume.threshold |
Specifies the node's disk threshold (in %) above which the email notification HIGH_CONSUMED_RESOURCES will be sent and the corresponding run will be marked by the label |
system.memory.consume.threshold |
Specifies the node's memory threshold (in %) above which the email notification HIGH_CONSUMED_RESOURCES will be sent and the corresponding run will be marked by the label |
Example of these settings:
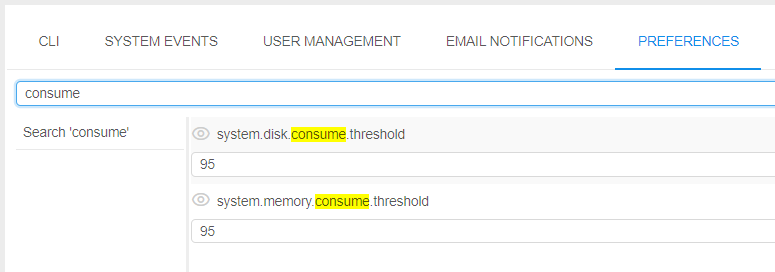
So, when memory or disk consuming will be higher than a threshold value for a specified period of time (in average) - a notification will be sent (and resent after a delay, if the problem is still in place. The default repeat delay is 30 minutes, it could be configured before the stand deployment).
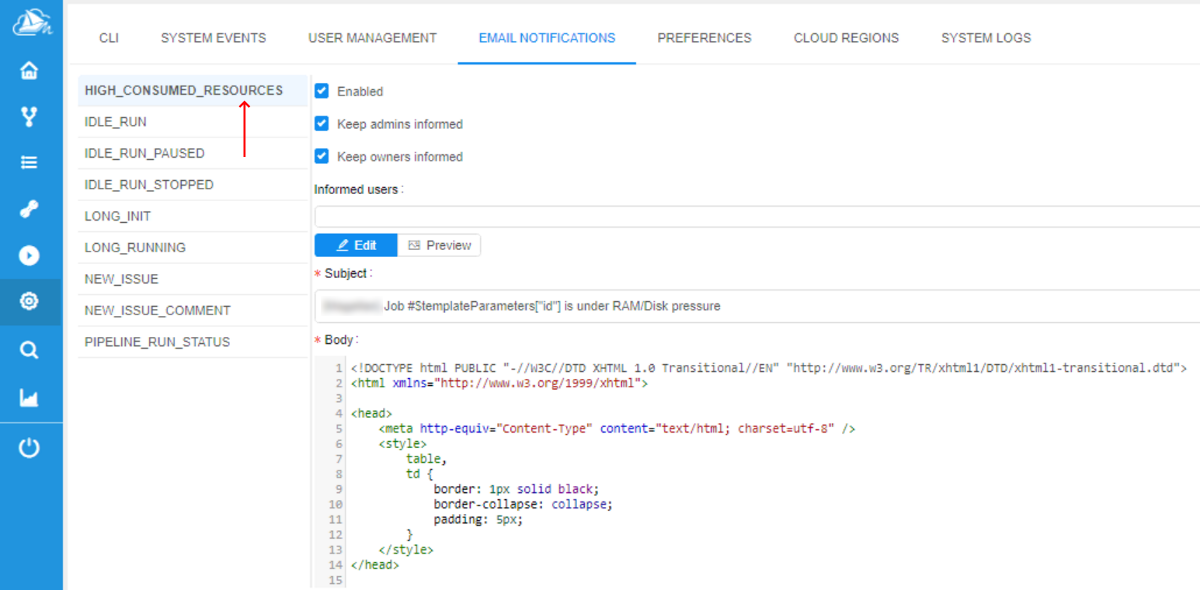
Preferences of the notification could be configured at the HIGH_CONSUMED_RESOURCES section of the Email notifications of the system-level settings:
"Network pressure" runs
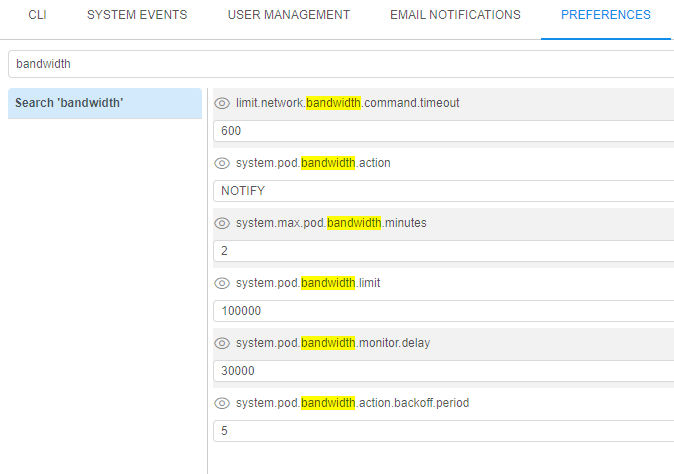
The system behavior for the "network pressure" runs is defined by the set of the following System-level parameters (Preferences):
| Preference name | Description |
|---|---|
system.pod.bandwidth.limit |
Defines the network bandwidth limit (in bytes/sec). Default value is 0 - this means there is no limit. |
system.max.pod.bandwidth.minutes |
Specifies the duration in minutes after which the system will check pod's network consuming in case when system.pod.bandwidth.limit > 0.If after this duration pod's network consuming is still higher than system.pod.bandwidth.limit - email notification HIGH_CONSUMED_NETWORK_BANDWIDTH will be sent to the userand the run itself will be marked by the label. |
system.pod.bandwidth.action.backoff.period |
Specifies the duration in minutes. If pod's network consuming is higher than system.pod.bandwidth.limit for this duration of time after the system.max.pod.bandwidth.minutes is over - an action,specified in system.pod.bandwidth.action will be performed. |
system.pod.bandwidth.action |
Sets which action to perform with the pod, that has the network consuming higher than system.pod.bandwidth.limit.Currently, possible actions:
|
system.pod.bandwidth.monitor.delay |
Specifies period (in milliseconds) between the scannings of running pods to collect the monitoring metrics. After each such period, it's defined to display label for the specific instance or not |
limit.network.bandwidth.command.timeout |
Specifies the duration in seconds. Till this duration platform will try to perform the limit network bandwidth command in case when admin sets the network limit boundary manually via API - see details below. |
Example of these settings:
In general, the behavior will be the following:
- User launches a run
- If
system.pod.bandwidth.limit>0, then aftersystem.max.pod.bandwidth.minutesperiod, the system starts to check pod's network consuming. - If the pod's network consuming is higher than
system.pod.bandwidth.limit:- email notification HIGH_CONSUMED_NETWORK_BANDWIDTH is being sent
- the run itself is being marked by the label
- After
system.pod.bandwidth.action.backoff.period, if the pod's network consuming is still higher thansystem.pod.bandwidth.limitandsystem.pod.bandwidth.actionis set as NOTIFY, email notification HIGH_CONSUMED_NETWORK_BANDWIDTH is being sent again. - Email notifications HIGH_CONSUMED_NETWORK_BANDWIDTH continue to be sent every
system.pod.bandwidth.action.backoff.period, if the pod's network consuming remains higher thansystem.pod.bandwidth.limit. - The state of the label (to display or not) is checked every
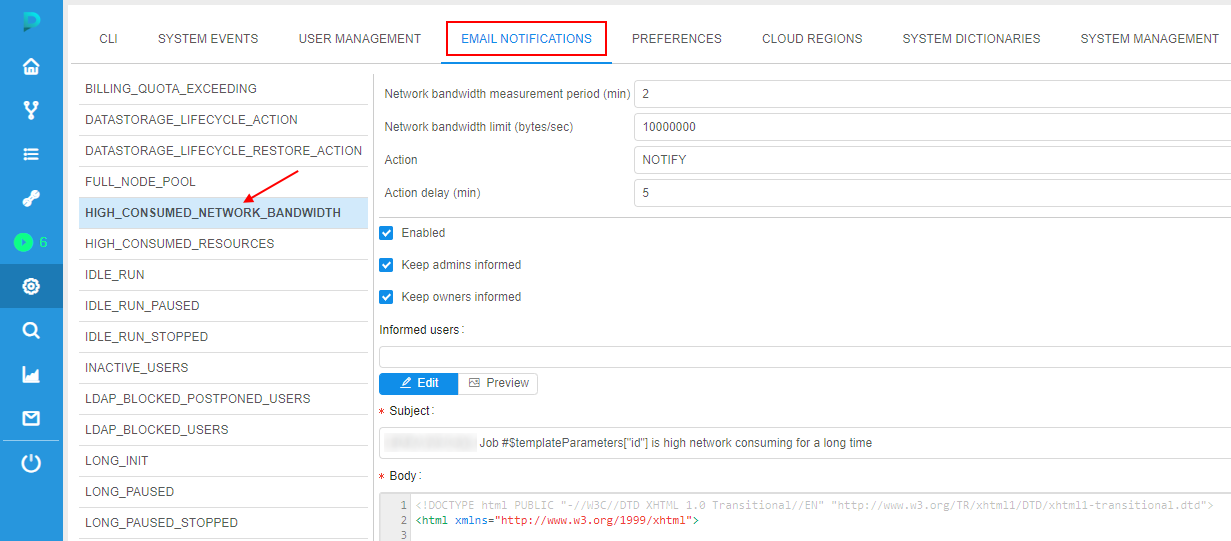
system.pod.bandwidth.monitor.delay. - The settings of the email notifications (message, the list of informed users, etc.) can be configured by admins via the corresponding tab Email notifications of the system-level settings:
Limit pod's network bandwidth
Admins can restrict specific pod's bandwidth to avoid high network consuming - through Cloud Pipeline API.
Currently, setting of the restriction through GUI is not supported.
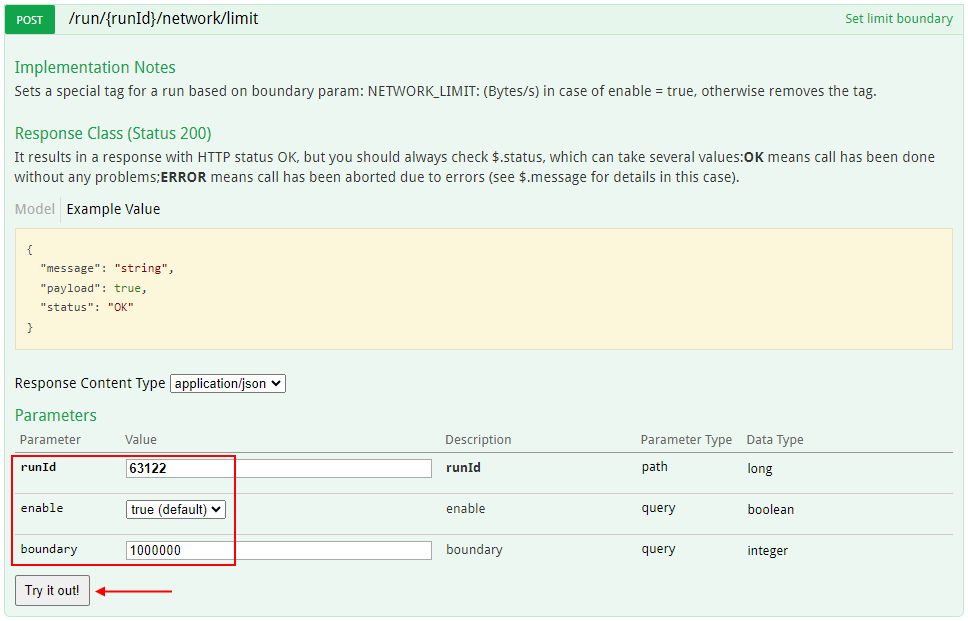
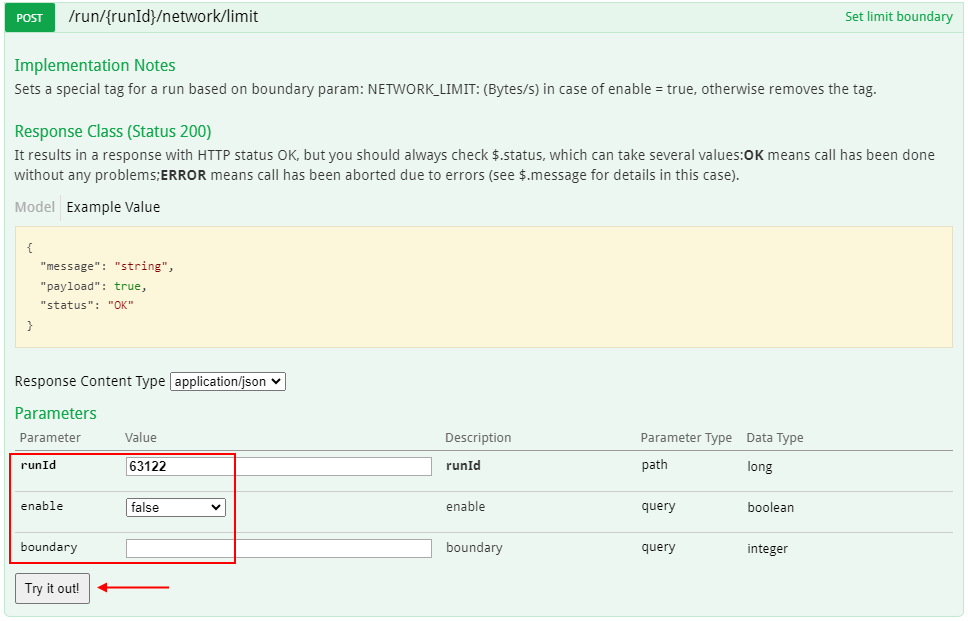
API method to set a bandwidth limit: POST /run/{runId}/network/limit?enable=<boolean>&boundary=<int>.
Where:
{runId}- run IDenable=<boolean>- option that enables/disables a bandwidth limit for a specific podboundary=<int>- option that sets a size of bandwidth boundary limit in bytes/sec
This method sets a special tag for a run based on specified boundary limit: NETWORK_LIMIT: <boundary>. Setting of such tag initializes bandwidth limitation process.
Only admins are able to call this method.
General journey of pod's bandwidth limitation looks like:
- Admin sets the bandwidth boundary limit for a run via API method
POST /run/{runId}/network/limit, specifying:- run ID
enableoption astrue- bandwidth boundary limit as integer value
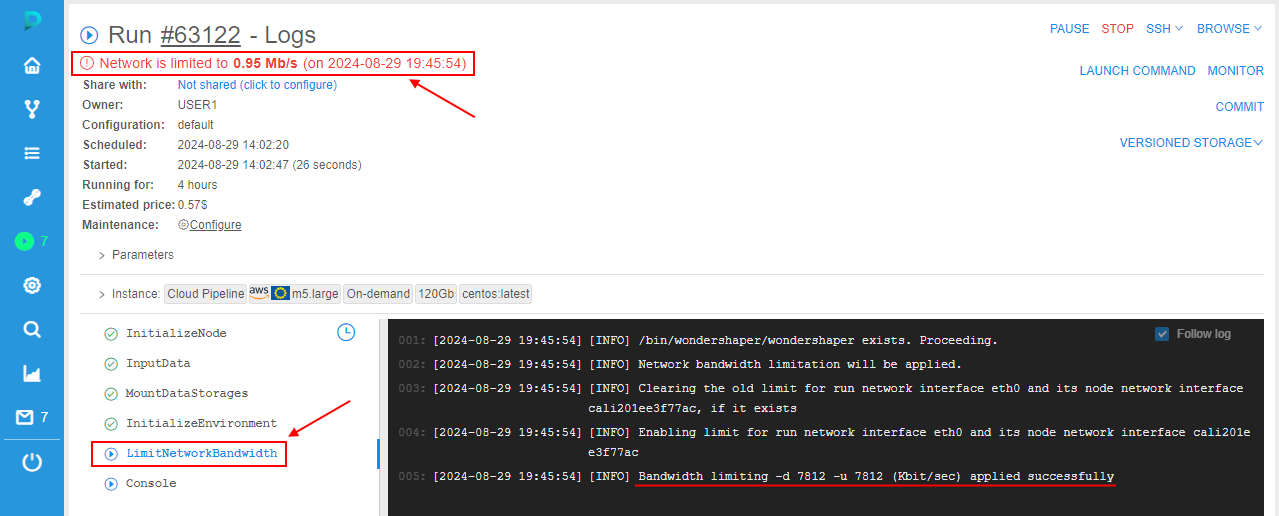
- In case of successful method call, after approximately the
system.pod.bandwidth.monitor.delayperiod of time:- at the run logs page, the warning message appears with the bandwidth limit and datetime when this limit will be applied to the the pod
- in run logs, the task
LimitNetworkBandwidthappears. This task contains logs of the bandwidth limit applying
Note: in case when server can't perform bandwidth boundary limitation commands from the first time, it will retry to perform commands untillimit.network.bandwidth.command.timeoutperiod is over.
- From the time moment, displayed in the warning message of bandwidth limit at the run logs page, pod bandwidth will be limited. It can be observed via the instance monitoring:
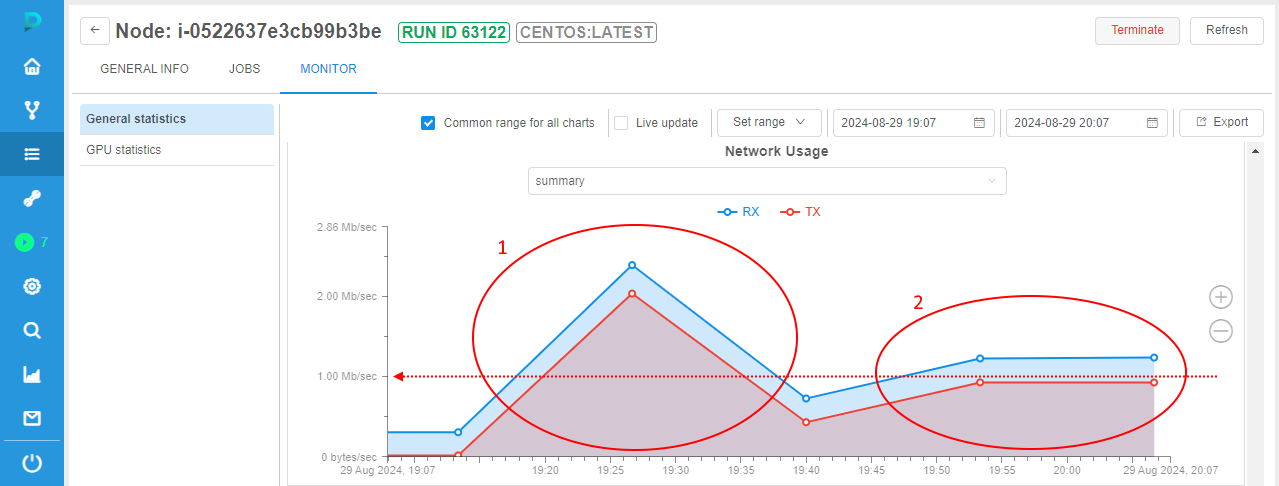
In the example above, the same large file was downloaded twice:- First time (see area 1) - without any bandwidth limitations.
- Second time (see area 2) - with the bandwidth limitation that was set at the first step (
1000000bytes/sec).
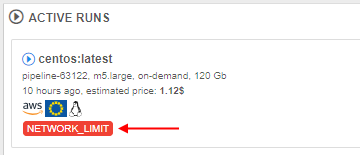
- Also, at the main Dashboard (Active Runs section) and at the Runs page, additional label will appear for a run -
NETWORK_LIMIT, e.g.:
- To remove a bandwidth boundary limit for a pod, call API method
POST /run/{runId}/network/limitwithenableoption asfalse:
- After the removing a bandwidth boundary limit:
- label
 will disappear from the main Dashboard (Active Runs section) and from the Runs page
 - at the run logs page, the warning message about the bandwidth limit will disappear
- in the run logs (task
LimitNetworkBandwidth), corresponding log will appear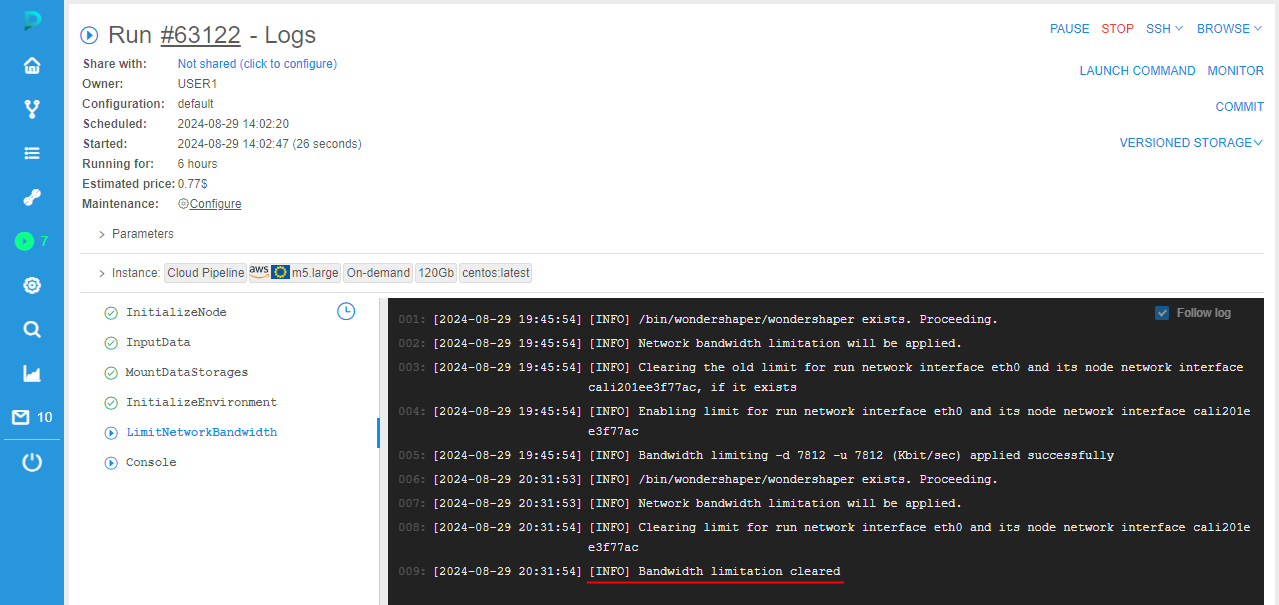
- label